BCG Matrix: What to Know and How to Use It
Learn how to use the BCG Matrix for strategic planning. Explore key insights and tips to maximize growth and profitability in your business.
Posted March 6, 2025

Table of Contents

Have you ever wondered how successful companies manage their diverse product portfolios? Enter the BCG Matrix, a powerful tool that has revolutionized strategic planning for businesses worldwide. This growth share matrix, developed by the Boston Consulting Group, offers a straightforward way to analyze and categorize your product lines based on their market growth and relative market share.
In this article, you'll discover what the BCG Matrix is and how to use it effectively. You'll learn about the strategic implications for each quadrant and see real-world BCG Matrix examples. Whether you're a seasoned business professional or just starting out, understanding this portfolio analysis tool can help you make smarter decisions about resource allocation and product strategy.
What is the BCG Matrix?
The BCG Matrix, also known as the growth share matrix or product portfolio matrix, is a powerful business planning tool that helps you evaluate the strategic position of your company's product portfolio. Developed by the Boston Consulting Group in 1970, this framework has become one of the most popular methods for portfolio analysis.
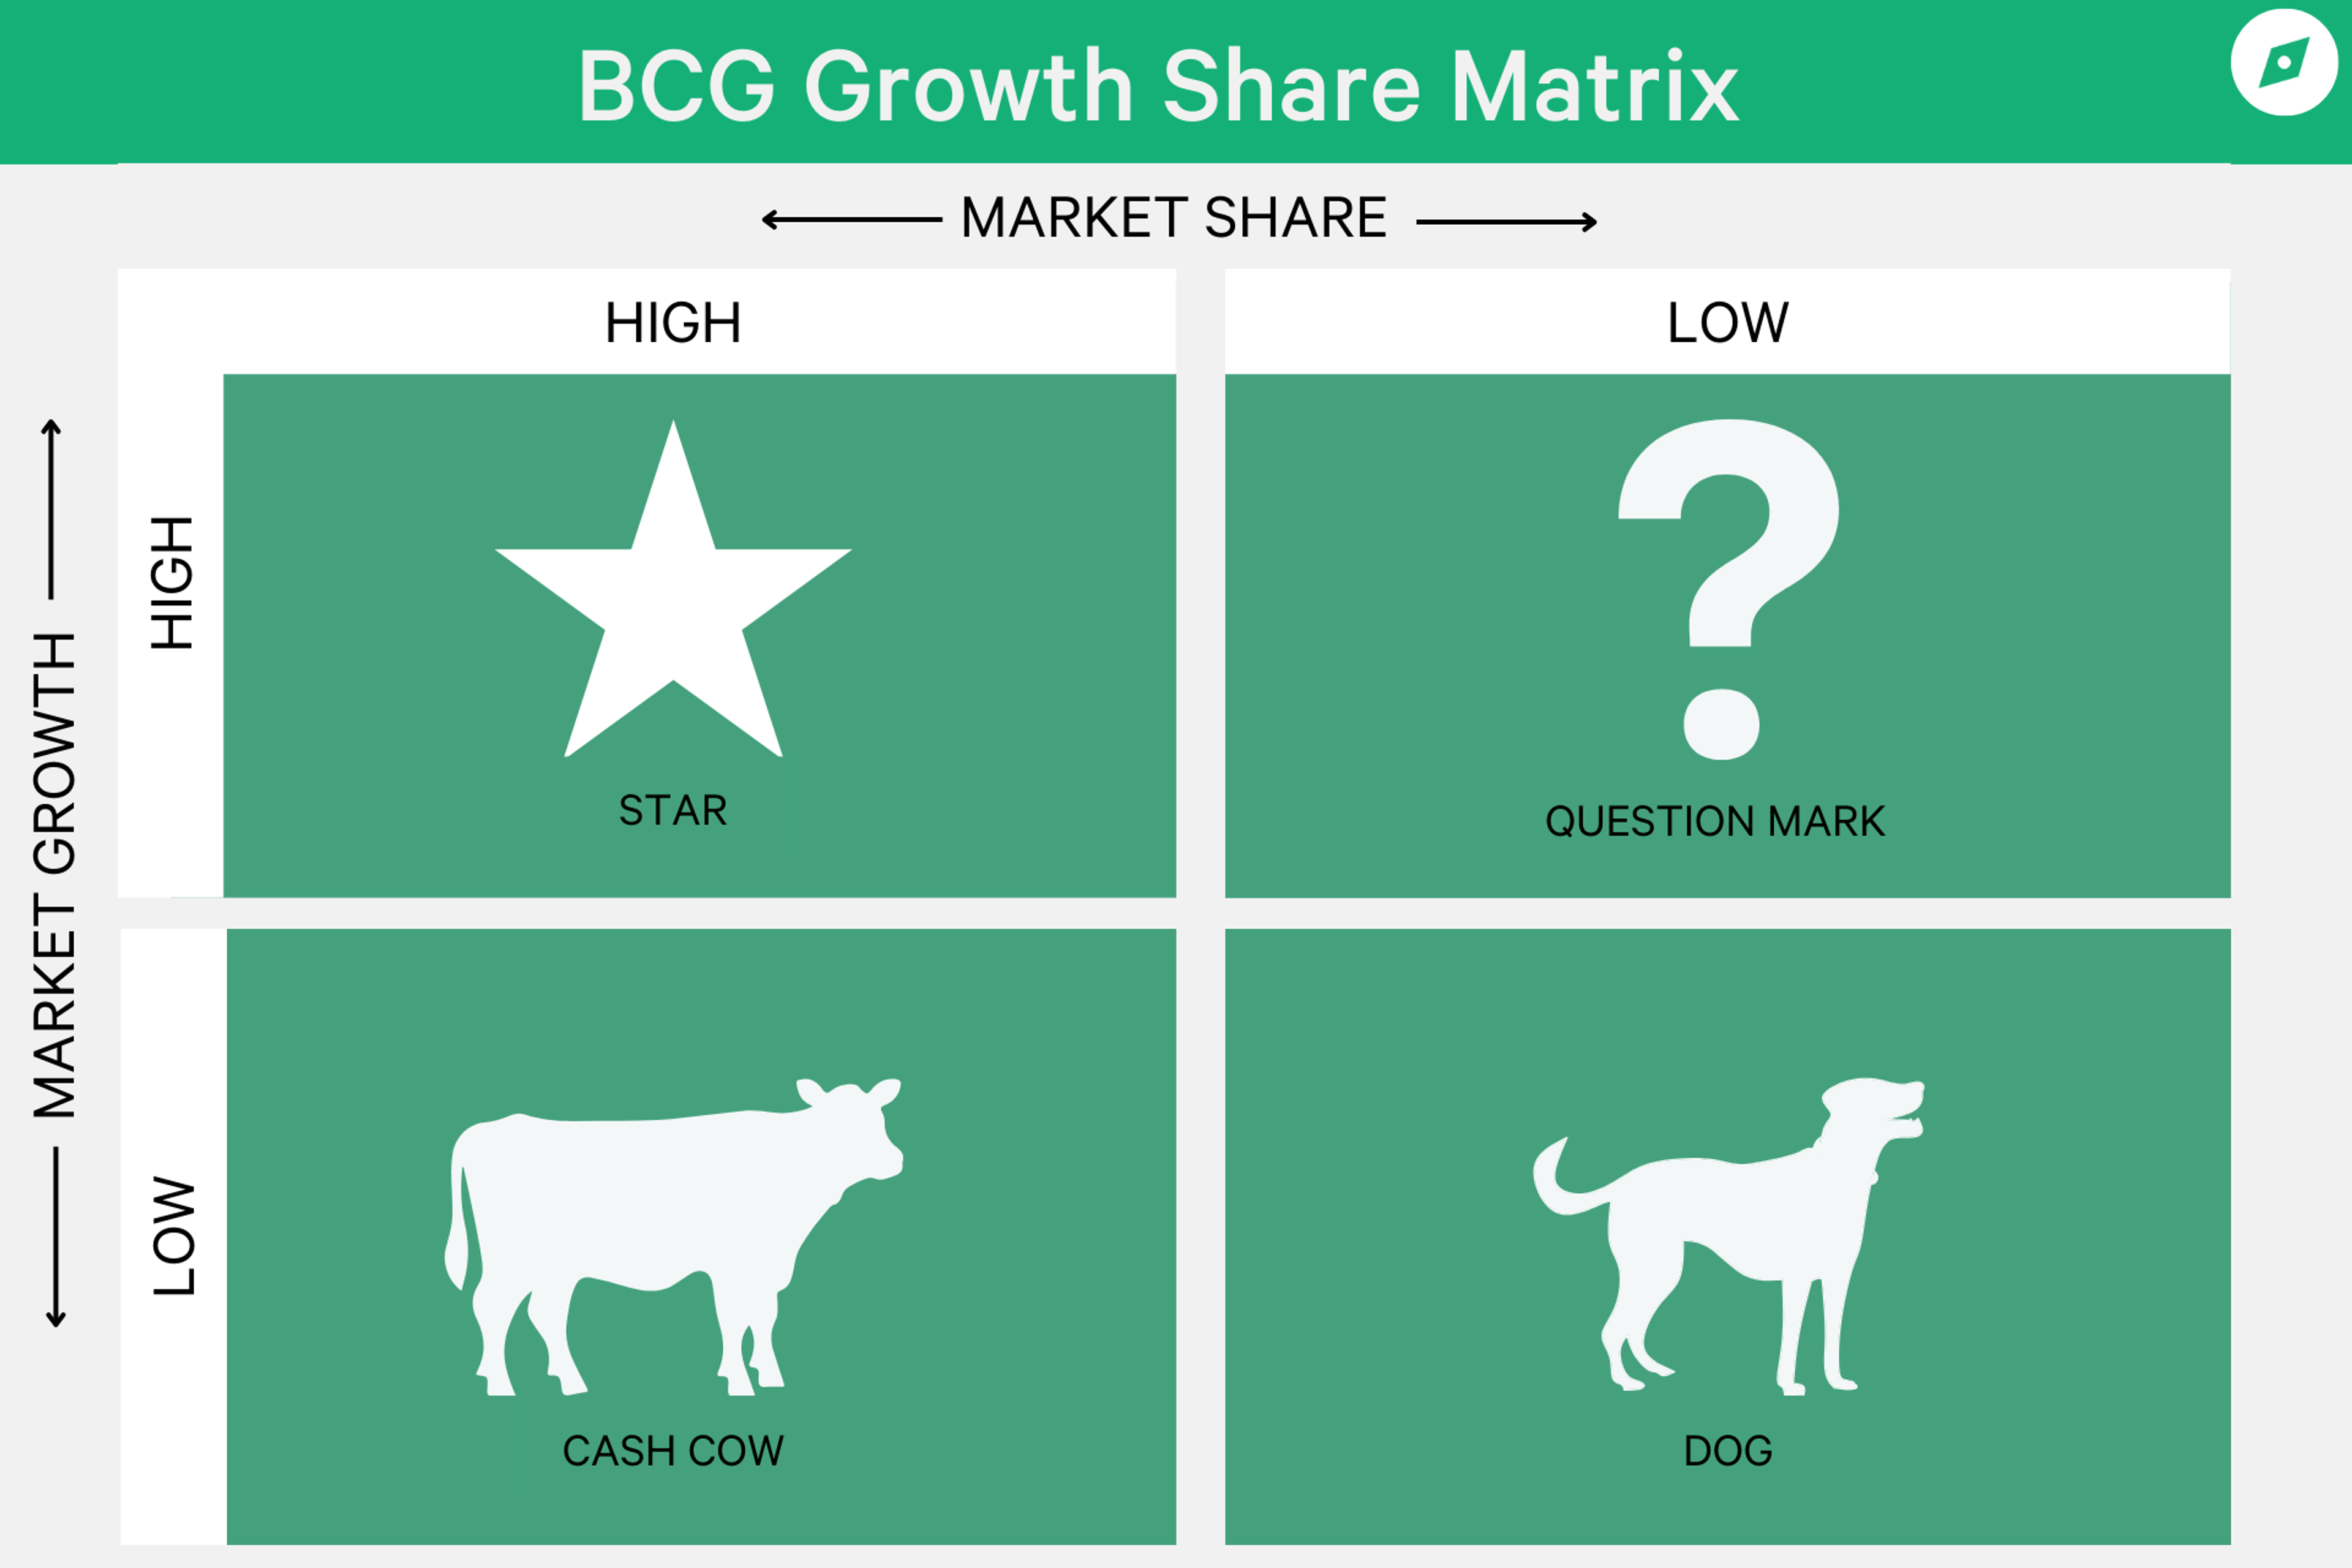
The BCG growth share matrix categorizes products into four quadrants based on their market share and market growth rate: Stars, Cash Cows, Question Marks, and Dogs. Stars represent products with high market share in high-growth markets and are often seen as market leaders with potential for future growth. Cash Cows have high market share in low-growth markets, generating steady revenue with little investment. Question Marks have low market share in high-growth markets, requiring careful consideration to determine if they can become Stars. Finally, Dogs have low market share in low-growth markets and may be candidates for divestiture. This analysis helps companies allocate resources efficiently and strategically plan for the future.
What is the BCG Matrix?
The BCG Matrix, also known as the growth share matrix or product portfolio matrix, is a powerful business planning tool that helps you evaluate the strategic position of your company's product portfolio. Developed by the Boston Consulting Group in 1970, this framework has become one of the most popular methods for portfolio analysis.
The BCG growth share matrix categorizes products into four quadrants based on their market share and market growth rate: Stars, Cash Cows, Question Marks, and Dogs. Stars represent products with high market share in high-growth markets and are often seen as market leaders with potential for future growth. Cash Cows have high market share in low-growth markets, generating steady revenue with little investment. Question Marks have low market share in high-growth markets, requiring careful consideration to determine if they can become Stars. Finally, Dogs have low market share in low-growth markets and may be candidates for divestiture. This analysis helps companies allocate resources efficiently and strategically plan for the future.


The Four Quadrants of the BCG Matrix
The BCG Matrix consists of four quadrants, each representing a distinct category of products or business units with unique characteristics and strategic implications. Let's explore these quadrants in detail:
Stars: High Growth, High Share
Stars represent a product or business unit that operates in high-growth markets and holds a significant market share. A market leader like this requires substantial investment to maintain their position and boost growth, but they also generate large cash flows. Stars consume considerable resources but have the potential to become future cash cows as the market matures.
Cash Cows: Low Growth, High Share
Cash cows are products or business units with a high market share in mature, slow-growing industries. They require minimal investment to maintain their position and consistently produce positive cash flows. Cash cows are typically market leaders and generate returns higher than the market's growth rate. The revenue from cash cows can be used to invest in stars or question marks.
Question Marks: High Growth, Low Share
Question marks, also known as problem children, are products or business units in high-growth markets but with a low market share. They have the potential for market share growth but are not currently very profitable. Question marks consume significant resources and require extensive investment to increase their market share. These products should be analyzed frequently to determine if they're worth maintaining.
Dogs: Low Growth, Low Share
Dogs are products or business units with a small market share in slow-growing markets. They generate little cash and don't require large investments. Dogs are typically able to sustain themselves but have low or negative cash returns. Companies often phase out products in the dogs quadrant unless they complement existing products or serve a competitive purpose.
To better understand the BCG Matrix quadrants, consider the following table:
| Quadrant | Market Growth | Market Share | Strategic Implication |
| Stars | High | High | Invest for growth |
| Cash Cows | Low | High | Milk for cash |
| Question Marks | High | Low | Invest selectively |
| Dogs | Low | Low | Divest or reposition |
How to Use the BCG Matrix?
To effectively use the BCG growth share matrix, follow these steps:
- Identify Your Products: Start by listing all the products or business units within your portfolio that you want to analyze.
- Determine Market Share and Growth Rates: For each product, assess its market share relative to competitors and determine if it's in a high growth market.
- Plot on the Matrix: Using the growth share matrix framework, plot each product, categorizing them into one of the four quadrants.
- Analyze Each Quadrant: Evaluate the strategic position of each product. Stars are market leaders in a high growth market, requiring significant investment. Cash Cows generate steady cash flow with minimal investment needs. Question Marks require strategic decisions on whether to invest or divest. Dogs typically have low market share and low growth rates, often considered for divestment in a competitive business environment.
- Develop Strategic Actions: Based on your analysis, develop action plans to optimize your portfolio’s performance. This might include investing in Stars, maintaining Cash Cows, deciding on Question Marks, and divesting Dogs.
Strategic Implications for Each Quadrant
The BCG Matrix is a powerful tool that helps businesses allocate resources effectively and craft a strong business strategy. Understanding the implications of each quadrant allows you to develop targeted strategies to maximize growth and profitability.
Investment Strategies
When it comes to investment strategies, each quadrant of the BCG Matrix requires a different approach:
- Stars: These high-growth, high-market-share products should receive substantial investment. Your goal is to maintain or increase their market share and growth rate. By heavily investing in stars, you can defend them from competitors and exploit their synergies with other products.
- Cash Cows: These low-growth, high-market-share products need moderate investment. Focus on sustaining their market share and profitability while protecting them from erosion. They are typically market leaders and generate returns higher than the market's growth rate.
- Question Marks: These high-growth, low-market-share products require selective investment. Regularly evaluate them to decide whether to invest more, divest, or discontinue. Your aim is to improve their market share and growth rate, potentially transforming them into stars.
- Dogs: These low-growth, low-market-share products should receive minimal investment. Consider selling, liquidating, or terminating them to free up resources. Dogs often don't generate much cash and can become cash traps, tying up company funds for long periods.
Read: Decoding the Market Expansion Framework in Consulting
Resource Allocation
The BCG Matrix helps you allocate resources based on the strategic objectives and the competitive advantage of each product category. Here's how you can approach resource allocation:
- Prioritize stars and cash cows: Allocate a significant portion of your resources to stars to fuel their growth and to maintain their strong market position.
- Selectively invest in question marks: Evaluate the potential and feasibility of question marks before deciding on resource allocation.
- Minimize resources for dogs: Allocate minimal resources to dogs, focusing on minimizing losses and freeing up resources for more promising products.
Portfolio Balancing
To achieve a balanced portfolio, consider the following strategies:
- Leverage cash cows: Use the revenue generated by cash cows to invest in stars or promising question marks.
- Nurture potential stars: Identify question marks with high potential and invest in them to transform them into stars.
- Divest underperforming products: Consider eliminating dogs from your portfolio to optimize resource allocation and focus on more profitable products.
- Diversify your portfolio: Aim for a mix of products across different quadrants to ensure long-term stability and growth potential.
Real-World Applications
Case Study: Apple
To understand how the BCG Matrix works in practice, let's examine Apple's product portfolio. Apple has successfully used this strategic tool to manage its diverse range of products and maintain its market leadership.
In Apple's BCG Matrix, iPhones stand out as the company's "Stars." These products enjoy a high market share and continue to show strong growth potential. With each new release, iPhones consistently break previous sales records, demonstrating their dominance in the booming mobile phone market.
Apple's "Cash Cows" include MacBooks, iMacs, and iTunes. These products have maintained a strong market share over the years, generating steady cash flows for the company. Despite facing competition, they've retained their position due to Apple's fiercely loyal customer base.
The "Question Marks" in Apple's portfolio include Smart TVs and smartphones still in the growth phase. While these products currently have a low market share, they show potential for significant growth. With strategic marketing and ecosystem improvements, Smart TVs could potentially become stars, mirroring the iPhone's success trajectory.
Lastly, iPods represent Apple's "Dogs." Once dominant, these products have seen declining demand due to the emergence of competing alternatives, resulting in reduced profitability.
Industry-Specific Adaptations
The BCG Matrix can be adapted to various industries, including digital marketing. In this context, you can apply the matrix to evaluate your digital assets:
- Cash Cows: Identify digital assets with high ROI and low growth, such as well-established social media pages or high-converting landing pages.
- Stars: Recognize digital assets with high ROI and significant growth potential, like emerging social media platforms or innovative advertising campaigns.
- Question Marks: These are digital assets with low ROI but considerable growth potential. Consider investing resources to nurture them into Stars.
- Dogs: Identify underperforming digital assets and assess if they can be improved or if resources should be reallocated.
Read: The Market Entry Framework: An Essential Tool for Consultants
Conclusion
The BCG Matrix’s four quadrants gives businesses a clear picture of their offerings' performance and potential. This framework has an influence on resource allocation decisions and helps companies to shape their growth strategies in a competitive landscape.
While the BCG Matrix isn't without its limitations, its enduring relevance in today's fast-paced business world is clear. From tech giants like Apple to digital marketing strategies, the matrix continues to guide companies to make smart choices about their products. As businesses navigate the ever-changing market scene, the BCG Matrix remains a trusted compass to balance their portfolios and steer towards success.
FAQs
How is the BCG matrix applied in business?
- The BCG matrix is utilized by analyzing the lifecycle of each product in a company's portfolio, which includes the stages of introduction, growth, maturity, and decline. This analysis helps in determining the correct positioning of each product within the matrix, aiding in strategic decision-making.
Can you explain the BCG matrix in simple terms?
- The BCG matrix is a graphical representation that plots products based on their market growth rate and relative market share. The vertical axis ranges from low to high growth rate, while the horizontal axis ranges from high to low market share. This creates four quadrants on the graph: Dogs, Question Marks, Cash Cows, and Stars, each representing different business scenarios.
What are some real-world examples of using the BCG Matrix?
- Many large corporations use the BCG Matrix to manage their product portfolios. For instance, a tech company might categorize its products like smartphones (Stars), older models (Cash Cows), emerging technologies (Question Marks), and discontinued products (Dogs) to decide where to invest and divest.
What strategic approaches are derived from the BCG matrix?
The BCG matrix suggests four main strategies:
- Build strategy: Focus on developing new brands and targeting new audiences, particularly for products categorized as Question Marks.
- Hold strategy: Continue to capitalize on successful products that are categorized as Stars to benefit from market growth.
- Harvest strategy: Maximize profits from products in the Cash Cow quadrant.
- Divest strategy: Consider selling off or phasing out products identified as Dogs.
Can the BCG Matrix be used for all types of businesses?
- The BCG Matrix is most effective for businesses with a diverse product portfolio. However, it can be adapted and used by companies of various sizes and industries to analyze their strategic positioning and make informed decisions.
What are the benefits of using the BCG Matrix?
- The benefits of using the BCG Matrix include better resource allocation and informed decision-making. It helps identify growth opportunities by evaluating each business unit's strategic position within the market. The matrix allows for a clearer understanding of which products operate in low market growth environments and which ones are poised for significant expansion, enabling companies to optimize their portfolios and focus on the most promising areas.
Read these next: